Signals you can check before you buy
You set the rules: instruments, timeframes, indicators, filters and risk. The service runs them over history and, if the rules hold up, watches the market and sends signals to Telegram.
There is no trial period — which is why the statistics are open before you register.
Public channel statistics
Computed from the same data the subscribers receive. Losing periods are not excluded and the windows are fixed — a favourable stretch cannot be cherry-picked.
- Closed signals
- 409
- Confirmed share
- 46.45 %
- Profit factor
- 0.69
- Maximum drawdown
- 12.54 п.п.
How these numbers are calculated
- Closed signals
- A signal is closed when its entry bar has ended and the outcome is known. Only signals published in active public channels and closed within the chosen window are counted. “Still open” are signals published in the window but not yet closed; they are not included in the metrics.
- Confirmed share
- A signal is confirmed if during the entry bar the price moved its way: for “up” the bar closes above its open, for “down” below. The entry bar is the first bar after the candle on which the signal was formed; its length equals the signal horizon. If the price did not change over the bar, the signal is not confirmed. The rate is confirmed divided by closed, in percent.
- Profit factor
- The sum of price moves of confirmed signals divided by the sum of absolute price moves of unconfirmed ones. A signal's move is the price change from the open to the close of the entry bar in percent, signed in favour of the signal direction. Above 1 means favourable moves add up to more than unfavourable ones. A dash means there were no unfavourable moves to divide by.
- Maximum drawdown
- The largest fall of the cumulative move curve from its previous peak, in percentage points. The curve starts at zero and adds up the moves of closed signals in order of closing.
Not included: fees, slippage, leverage and the actual entry price — the calculation uses the open of the bar after the signal, while your trade opens at the price when you receive the signal and send an order.
What the cabinet looks like
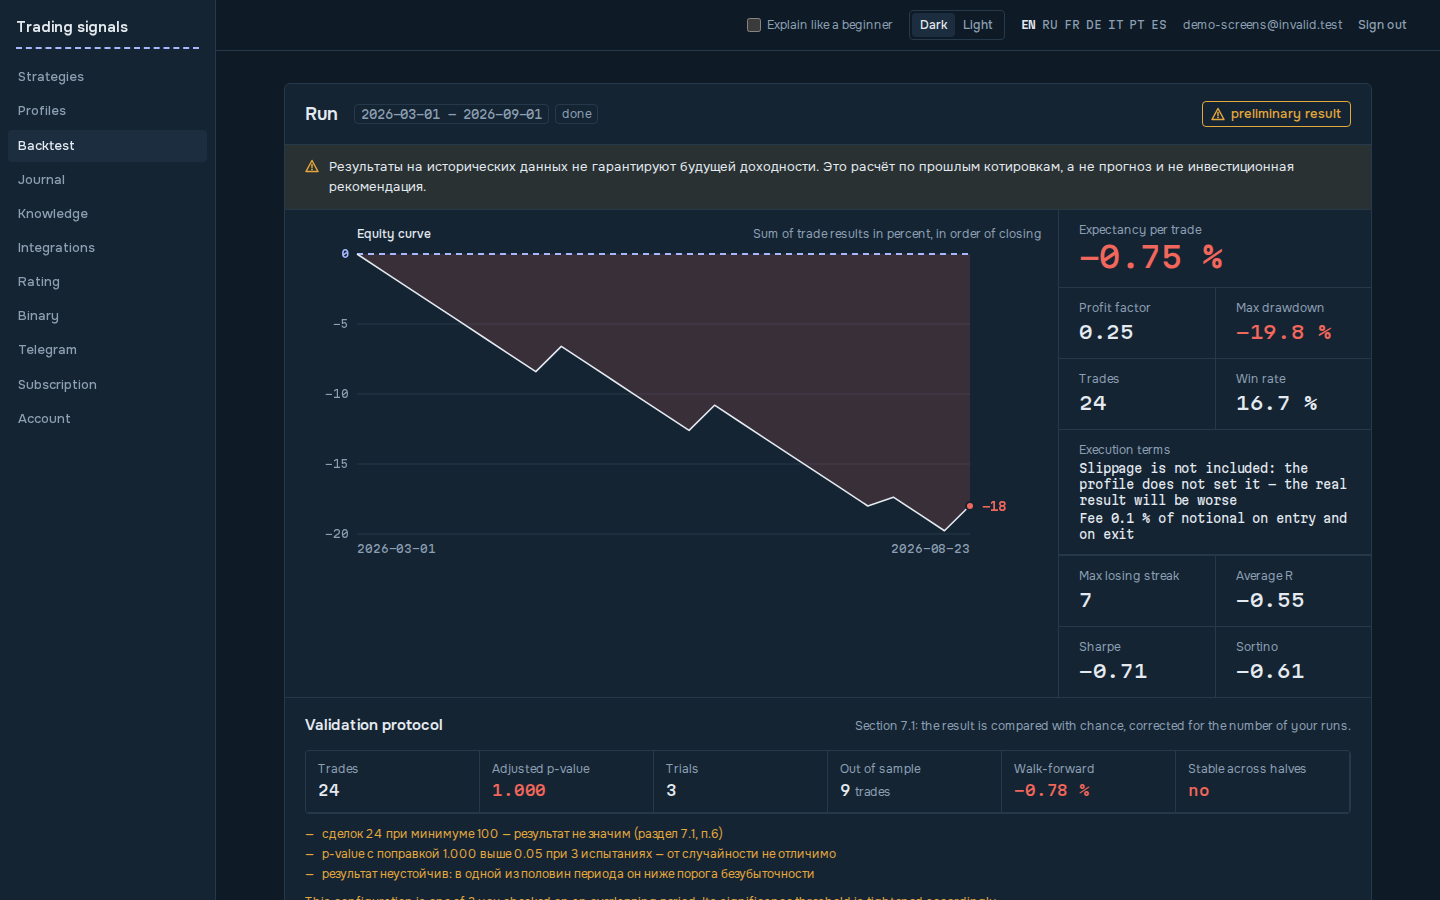
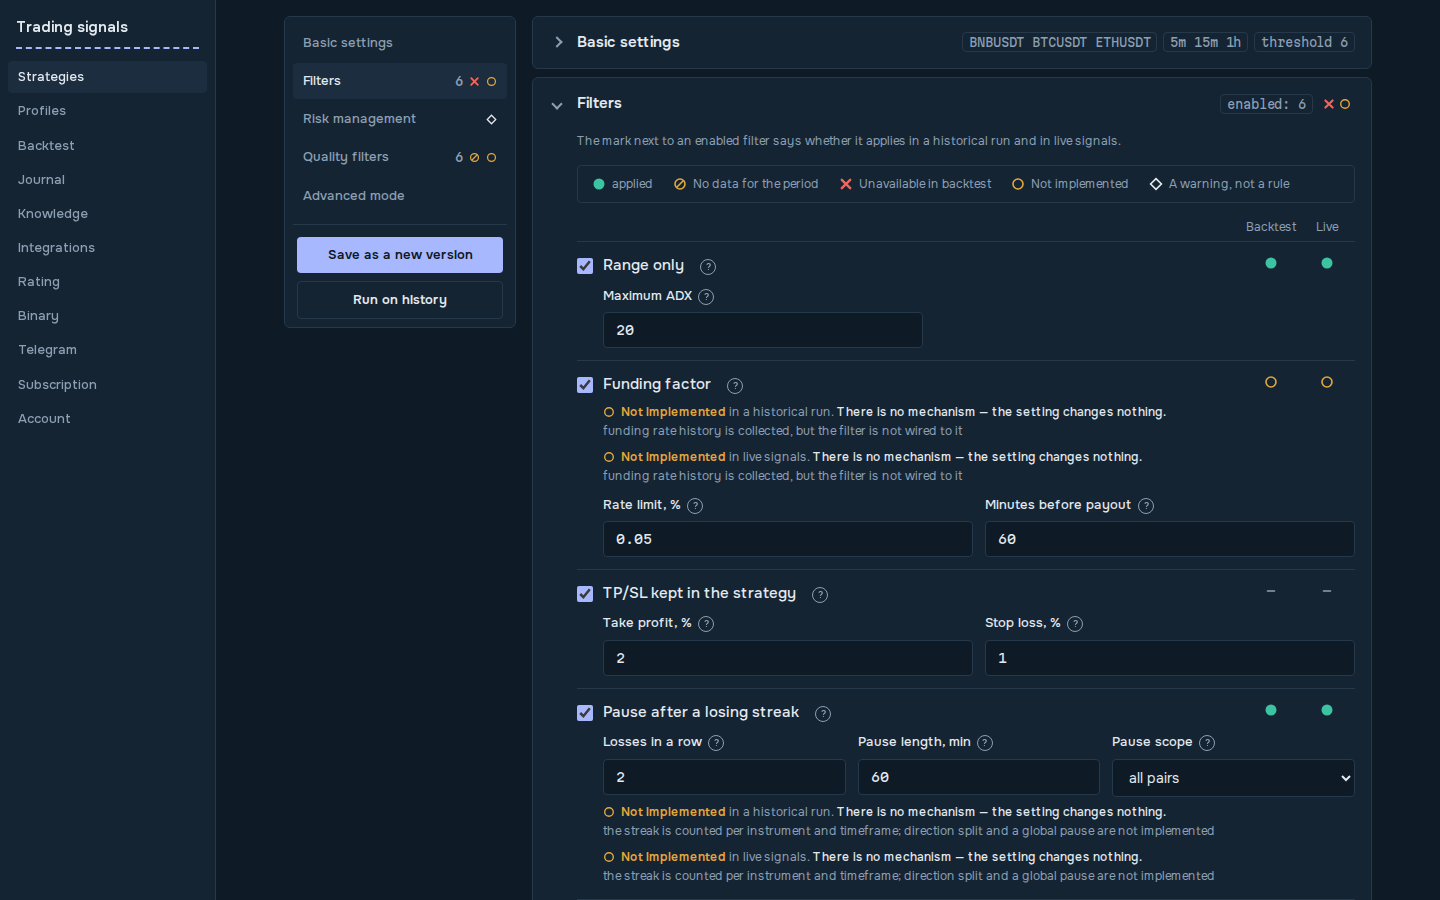
Screenshots of the live cabinet, a demo account with real runs, 2026-09-13.
What you will not find here
- Promises of returns. A signal shows an algorithmic estimate of the possible price direction over a given horizon. The estimate may be wrong and is not a guarantee of income.
- Access to your trading accounts. The service does not trade for you and cannot.
- Painted-on statistics. The numbers on this page are computed from the same data the channel subscribers see, losing periods included.
- A trial period. Instead: open statistics and a free channel — look as long as you like before paying.
Instruments
Live signals
BTCUSDT, ETHUSDT, BNBUSDT
Data from Binance, a delay of seconds after the candle closes. Timeframes from 3 minutes.
Backtest only
Forex and gold
History depth is 59 days on 15m and 725 days on 1h. There is no live data: it requires a licensed source. A strategy with these instruments can be backtested but not enabled.
How it works
- 1
Build a strategy
Instruments and timeframes from the catalog, weighted indicators, trading sessions, volatility and news filters, position size and risk limits. Every setting has a tooltip — you should not have to guess what "minimum cores" does.
- 2
Test it on history
A run over real quotes for the period you choose. The result gives win rate, profit factor, drawdown, number of trades — and an honest note on which filters did not apply in the run and why.
- 3
Receive signals
The scanner works on closed candles and sends a signal to Telegram: instrument, direction, timeframe, horizon and score. Plus a follow-up when the horizon is over.
Latest channel signals
The feed updates automatically. Losing signals are not removed from it — that is the whole point of a checkable showcase.
A signal is formed after the candle closes. Between the calculation, delivery to Telegram and your trade the price may change. The order of delivery delay, as we measured it, is about a minute and a half to the last of a thousand recipients.
| Instrument | Direction | Horizon | When | Result |
|---|---|---|---|---|
| BTCUSDT 3m | down | 3 мин | 2026-09-18 13:36 | not confirmed · -0.34 % |
| BTCUSDT 3m | down | 3 мин | 2026-09-17 03:27 | not confirmed · -0.03 % |
| BTCUSDT 3m | down | 3 мин | 2026-09-17 03:06 | confirmed · 0.06 % |
| BTCUSDT 45m | down | 45 мин | 2026-09-17 02:15 | not confirmed · -0.2 % |
| BNBUSDT 30m | down | 30 мин | 2026-09-16 18:30 | confirmed · 0.43 % |
| BNBUSDT 3m | down | 3 мин | 2026-09-16 17:18 | confirmed · 0.01 % |
| BTCUSDT 3m | down | 3 мин | 2026-09-14 09:33 | confirmed · 0 % |
| BTCUSDT 3m | down | 3 мин | 2026-09-14 06:09 | not confirmed · -0.09 % |
Plan
RUB 3,000 per month
- Strategies with the full set of settings and configuration versions
- History runs with the validation protocol
- Live signals and personal delivery to Telegram
- History of signals and their outcomes
Billed monthly, cancel any time — the period you paid for stays yours.
Frequently asked
Why is there no trial period?
Because the statistics are open instead: results of the public channel over 30, 90 and 180 days are available without registering, together with the feed of signals and their outcomes. Plus a free Telegram channel where signals arrive at no cost for as long as you like.
Do you trade for me?
No. The service has no access to trading accounts and sends no orders. It sends a signal; the decision and the execution are yours.
How is a signal different from investment advice?
A signal is a message the service generates automatically from the configured strategy settings: the direction of the expected price move and the horizon of that move. It contains no entry price, targets or loss limit — you set those yourself. Information from the service is provided for information purposes only and is not personal investment advice within the meaning of Russian Federal Law No. 39-FZ of 22.04.1996 “On the Securities Market”. You make all trading decisions yourself, at your own risk and responsibility.
What does "price move" mean in the statistics?
The change in the instrument's price over the signal horizon, in percent, signed in favour of the direction. It is not your profit: what a trade yields depends on the execution profile, leverage, fees and entry point.
Why is the price in my trade different from the price in the statistics?
The statistics measure the move from the open of the bar after the signal to that bar's close. Your trade opens later and at a different price: the signal is formed after the candle closes, then delivered to Telegram — about a minute and a half for a thousand recipients — then you decide and send an order, and the price may change in the meantime. Add the spread, slippage and fees of your broker or exchange, and with leverage the result is multiplied by it as well. So the result of your trade will differ from the price move in the statistics.
Why does a backtest not guarantee results?
Past results do not guarantee future ones. Any statistics, return curves and performance figures reflect past periods and are not a promise, forecast or guarantee. Backtest results are obtained by simulation on archived data. Such simulation does not fully account for slippage, spread changes, execution delays, platform failures, fees, swaps, market impact and psychological factors. Real results will differ from simulated ones, usually for the worse. The service states explicitly which factors a given calculation leaves out. On top of that, a run's result comes with a correction for the number of trials and an out-of-sample check: a perfect curve on history more often means overfitting than a working strategy.
Which instruments are available?
Live signals cover BTCUSDT, ETHUSDT and BNBUSDT: data from Binance, timeframes from 3 minutes. Major currency pairs and gold are backtest only: there is no live data for them, it requires a licensed source, and a strategy that includes them cannot be enabled. An instrument without data does not appear in the catalog.
Can I get a refund?
The refund terms are published on a separate page. Requests go to the support address shown at checkout.